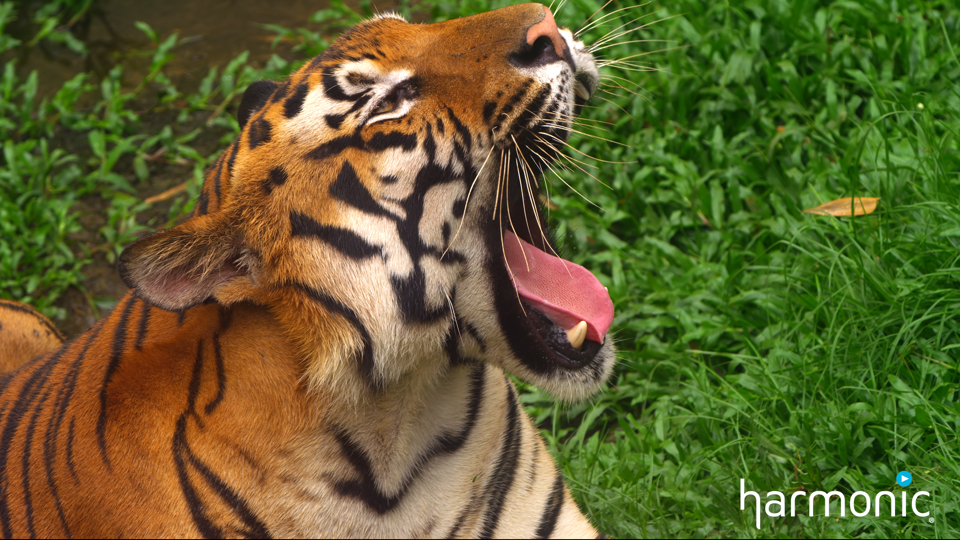


Image information can be divided into two components: the color information and the intensity information. In this interactive web page, the user can visualize these by selecting one of the images below. Once selected, the color and intensity distributions of the corresponding image will be shown. The color distribution is shown as multiple scatter plots, where each plot shows the correlation between a pair of colors. The intensity distribution is a histogram that shows the different intensity levels (measured by the luminance channel) at each pixel in the image. The user also has the option to select a smaller region of the image, in which case the plots will update to show the new data. Try it out!